Harnessing Heat Maps in Google Analytics: Insights for Website Optimization

What’s the first image that comes to your mind when you think about a heat map? Shades of yellow going into orange and then becoming red? Marking the beginning of a heatwave? You may not be wrong. But in the world of digital marketing, heat maps have a different meaning. Heat maps in Google Analytics tell you how visitors interact with your website and which areas of the page perform well. In the past (before 2019), Google Analytics offered a free heatmap tool called Page Analytics as a browser extension
Through this blog, we will go over
– Heat maps in Google Analytics
– Types of heat maps in Google Analytics
– How to improve user engagement with heat maps
What are the different types of heat maps in Google Analytics?
Heat maps are visual representations of how visitors behave on your website. Which pages do they spend more time on? What do they click more on? What didn’t interest them? Heat maps in Google Analytics use color gradients to show areas of high and low user interaction.
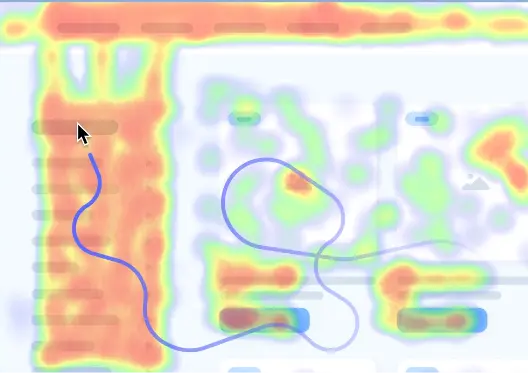
Hotter colors (typically red or orange) show areas where users click, scroll, or spend more time, while cooler colors (blues and greens) represent areas with less interaction. This color-coded approach clearly explains how visitors navigate your site and interact with its elements. Here are the different types of website heat maps of Google Analytics:
- Click heat maps: These heat maps tell you which elements users are most likely to click on on your website. They show popular Call-to-Actions (CTAs) and areas of user interest. Click heat maps can reveal potential problems like misplaced buttons or CTAs that blend into the background, leading to missed conversions.

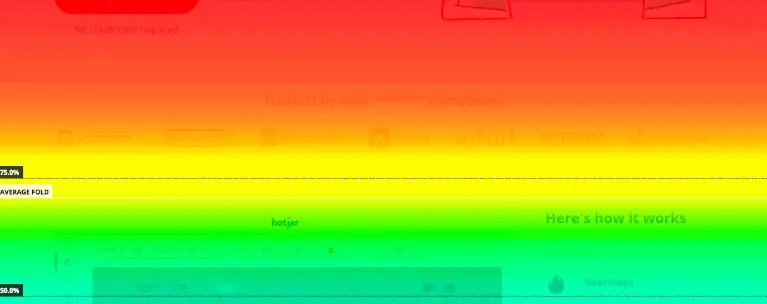
- Scroll heat maps: Understanding how far users scroll down the page is crucial. Scroll heat maps provide this insight, allowing you to identify content that might be getting missed or requiring optimization. Are users reaching your key information or compelling offers before scrolling away? Scroll heat maps can help you tailor content placement and prioritize valuable elements within the user’s initial view.
- Move heat maps (Desktop): These track user mouse movements, revealing areas of interest and potential confusion points. Are users hovering over specific elements but not clicking? This could imply a lack of clarity or a need for additional information. Move heat maps can also help identify areas of visual clutter or design elements that might be distracting- like pop-up windows!
What can heat maps help you with?
Heat maps aren’t just about tracking clicks and scrolls. They have a whole range of offer a range of benefits that can improve your website’s user experience and overall performance:
- Identifying Mis-clicks: Are users accidentally clicking on elements they don’t intend to? heat maps can expose design flaws and areas needing refinement. For instance, a CTA button placed too close to another element might lead to unintended clicks.
- Mobile Optimization: In mid-2023, it was estimated that 96% of the global digital population uses a mobile device to connect to the internet. So, understanding how users interact with your site on mobile screens is important in today’s mobile-first world. heat maps can reveal if essential elements are difficult to tap on or if issues with the formatting of your content lead to user frustration. By using heat maps, you can create a website that feels effortless on mobile. This means users can find what they need and interact with your site seamlessly, no matter what device they’re using.
- A/B Testing Design Changes: heat maps can be used to measure the effectiveness of different design layouts and CTAs. By comparing heat maps from A/B tests, you can see how users respond to changes in button placement, content organization, or even color schemes. This data-driven approach lets you to optimize your website for better results and increase user engagement.
- heat maps and User Journeys: heat maps help you understand the user journey on your website. By analyzing click and scroll patterns, you can identify where users enter the site, what content they engage with, and where they might drop off. With this information, you can optimize the user flow, ensuring a smooth journey toward what action you want your customers to eventually take.
How to Read a Heat Map?
Reading heat maps in Google Analytics is simple! heat maps use color to show concentrations of data. Imagine a checkerboard where each square represents a data point. Hotter colors, like red and yellow, represent higher values, while cooler colors, like blue, mean fewer. Look for patterns in color intensity across the map. Areas glowing red indicate a lot of activity, clicks, or whatever the heat map measures. Cool blue areas show less interaction. A legend usually explains the color scale. heat maps help visualize trends at a glance, making data analysis faster and easier.
Improving your User Engagement with Heat Map Insights
The power of heat maps in Google Analytics lies in their ability to translate user behavior into actionable insights. Visitor insights fuel data-driven decisions to:
- Improve User Experience (UX): Use heat maps to refine your website’s design and functionality to create a more intuitive and engaging user experience. Address areas of confusion by providing more precise navigation, improving content placement, and optimizing calls to action.
- Boost Conversions: User insights from heat maps can help you optimize your CTAs and critical content areas. For instance, by identifying where users typically drop off in a purchase funnel, you can refine the checkout process or add relevant information to address potential concerns.
- Increase Website Traffic: heat maps in Google Analytics can help identify content gaps and areas for improvement. Are there sections of your website with minimal user engagement? This might indicate a need for a content refresh, improved visuals, or a different approach altogether. Concentrating on these areas and creating more engaging content can create a more attractive website that retains visitors and encourages them to return for more.
How do you set up a Google Analytics Heatmap?
- Install Chrome Extension: To start using a heatmap with GA, you must go to the Chrome Extension store, look for Page Analytics Chrome Extension (By Google), and install the Google Analytics heat map extension to start using heatmap.
- Activate the Chrome extension: After installation, go to your website and click on the Page Analytics app on top of your Chrome browser. This should show that you have successfully installed it. However, to use Google Heat Map, you will need an account and Analytics code installed on your website.
- Start Analysing your website with heat maps in Google Analytics: Start using the Heatmap on your website by clicking on the Message Bubble icon, and it will show you the percentage of clicks threshold you get on each of the elements on your site.
No update since 2019
You’ve gone through all the steps and installed Google Heat Maps, but it’s just not working! Fret not; you are not alone. Ever since Google withdrew support in 2019, several users have been facing issues. You could maybe explore other heat map tools available in the market. After all, heat maps are a great tool for any website owner or marketer who wants to understand their audience and optimize user engagement. However, it’s important to remember that heat maps in Google Analytics are just one piece of the puzzle. Combine heat map insights with other website analytics data and user testing to gain a holistic view of user behavior.
Furthermore, user behavior and trends can evolve. Regularly revisit your heat maps to analyze changes in how visitors interact with your website. This monitoring allows you to stay ahead of the curve and continuously optimize your website for an engaging and successful user experience.